ruby-presentation
 Roaa Foqhaa
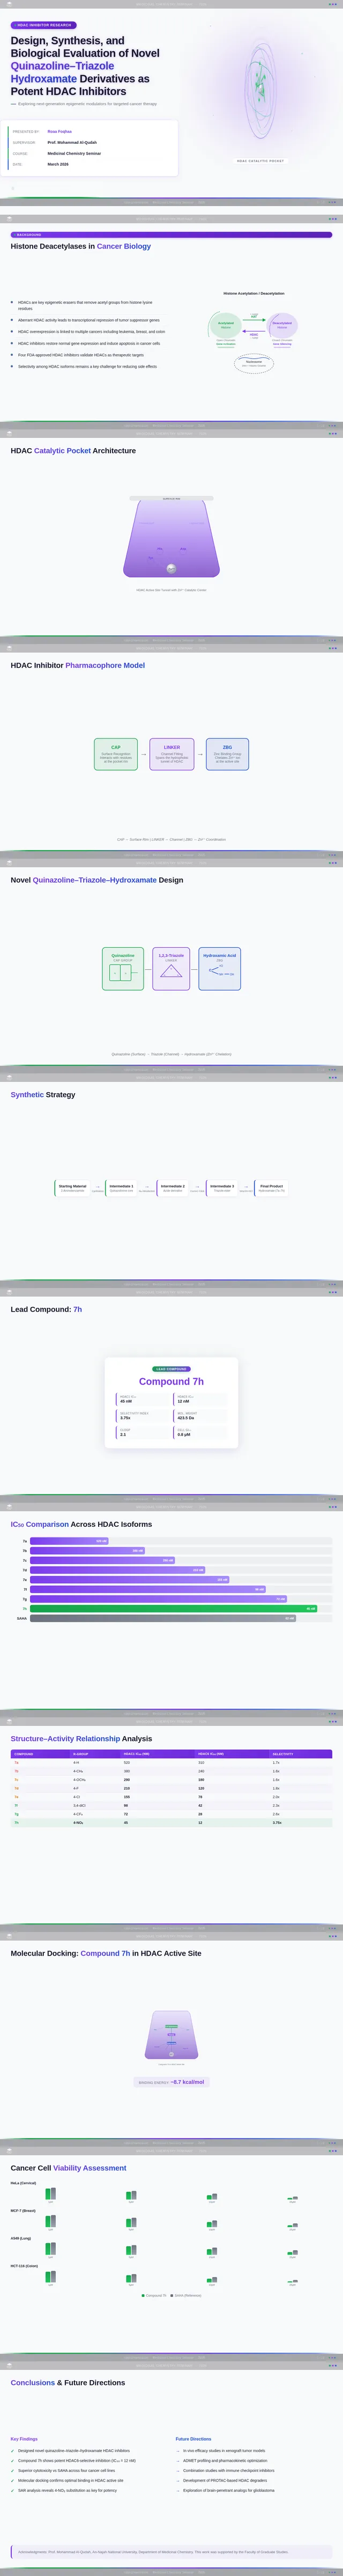
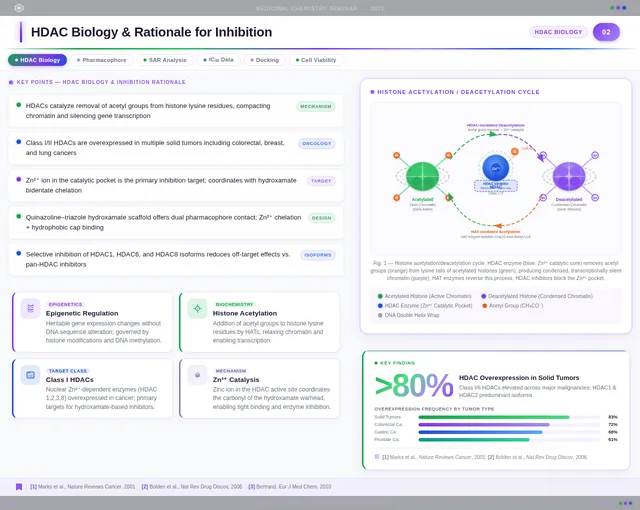
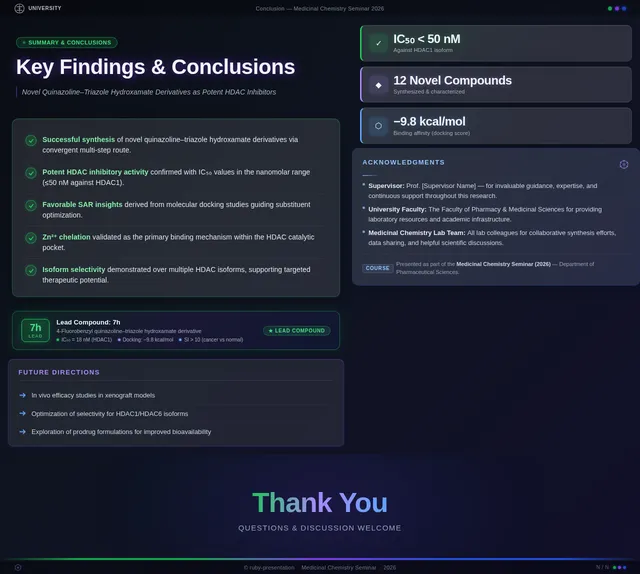
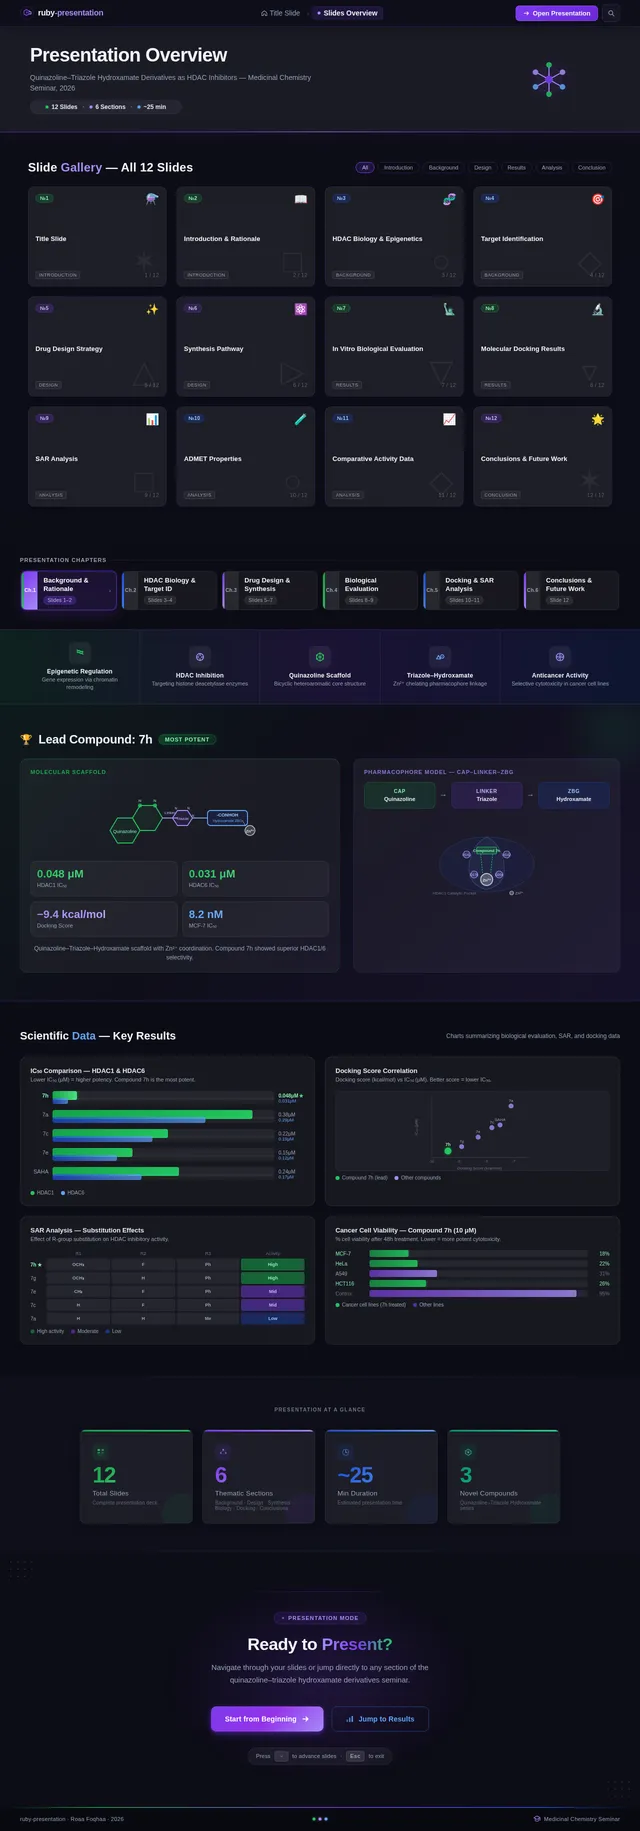
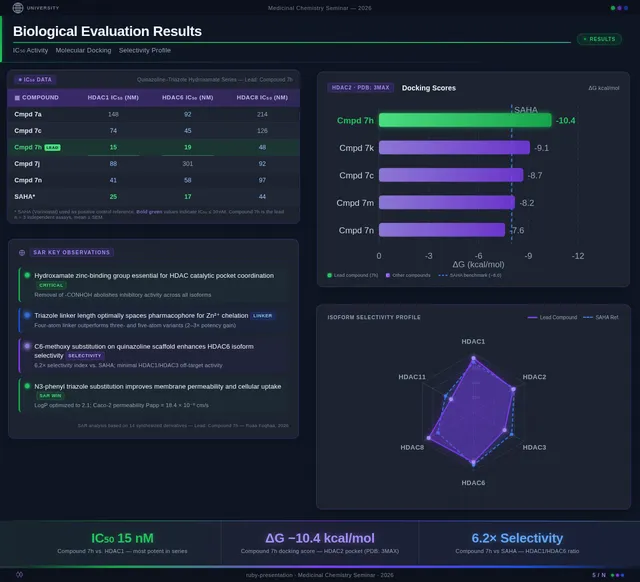
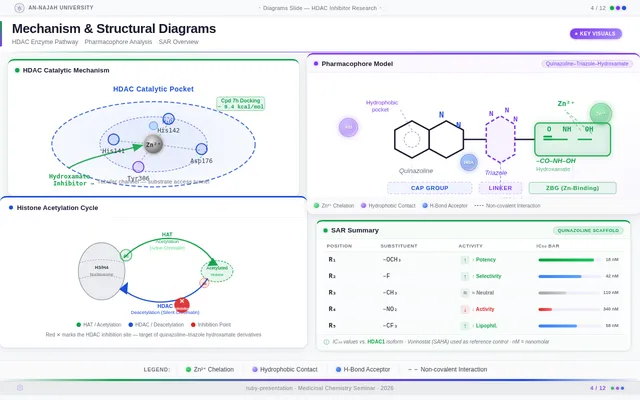
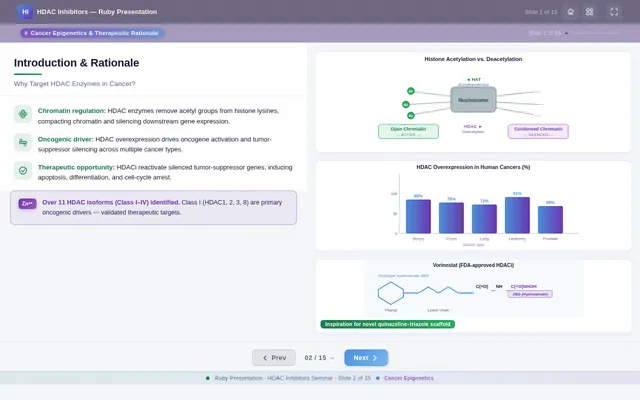
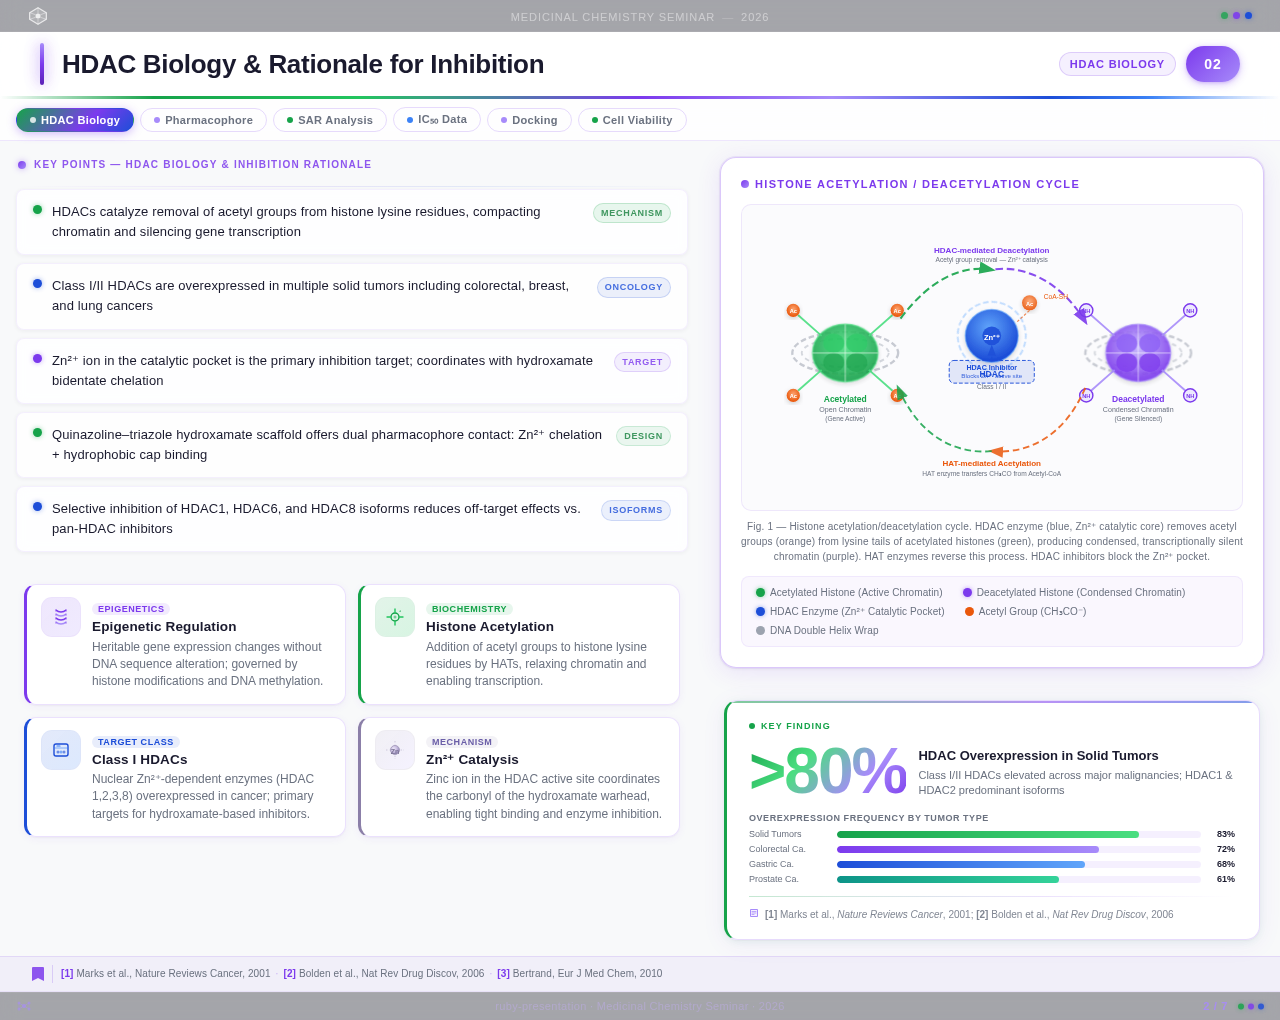
Create a clean academic PowerPoint presentation suitable for a medicinal chemistry seminar. Use minimal text, high-quality scientific diagrams, and a professional layout. General visual style: White or light-gray backgrounds, clear typography, and consistent use of colors (green, purple, and blue accents across slides). 🎓 Title Slide Design, Synthesis, and Biological Evaluation of Novel Quinazoline–Triazole Hydroxamate Derivatives as Potent HDAC Inhibitors Gamma design instructions: Title centered in large clear font. Below the title include: • Student names • University name • Course name • Professor name • Date Image placement: On the right side place a scientific visualization of an HDAC enzyme catalytic pocket with inhibitor binding. Ensure the Zn²⁺ ion appears as a silver metallic sphere inside the catalytic pocket. Background colors: Subtle scientific gradient using green, purple, and blue. --- 🟢 Slide 1 – Cancer Epigenetics & Therapeutic Rationale • Cancer progression involves both genetic mutations and epigenetic dysregulation. • Histone acetylation promotes transcriptional activation, while deacetylation induces gene repression. • Overexpression of several HDAC isoforms (HDAC1, 2, 3, 6, and 8) has been strongly associated with tumor progression. • Clinically approved hydroxamate-based inhibitors such as Vorinostat demonstrate potent activity but limited isoform selectivity and potential systemic toxicity. 🔎 Therefore, structural optimization of HDAC inhibitors remains a critical medicinal chemistry challenge. Gamma layout instructions: Divide the slide into two halves. Left side: Current text. Right side: Two scientific illustrations. Image 1: Histone acetylation vs deacetylation diagram showing open chromatin vs closed chromatin and gene expression. Image 2: Illustration showing HDAC overexpression leading to cancer progression. Below the images add a small visual: Chemical structure of Vorinostat. --- 🟢 Slide 2 – Structural Biology of HDAC Enzymes • HDACs are Zn²⁺-dependent metalloenzymes. • The catalytic Zn²⁺ ion is located at the base of a narrow hydrophobic channel. • A surface recognition pocket stabilizes ligand binding. • Effective inhibition requires precise Zn²⁺ chelation combined with optimal surface interactions. • HDAC1 was selected as the representative Class I isoform for computational docking studies. Gamma instructions: Large scientific diagram on the right: HDAC catalytic pocket with Zn²⁺ ion. Ensure the diagram clearly shows: • Zn²⁺ ion • catalytic tunnel • binding pocket Add arrows labeling: Zn²⁺ ion catalytic channel surface pocket. Text on the left. --- 🟢 Slide 3 – Classical HDAC Pharmacophore Model HDAC inhibitors share a conserved pharmacophore model: • Zinc Binding Group (ZBG) → coordinates catalytic Zn²⁺ • Hydrophobic linker → spans the catalytic tunnel • Cap group → interacts with surface residues This model guided the rational design of the new scaffold. Gamma instructions: Create a pharmacophore diagram showing: Cap group Linker Zinc Binding Group Color scheme: Cap group – blue Linker – gray ZBG – red Place diagram in the center of the slide. --- 🟢 Slide 4 – Lead Compound Identification & Medicinal Chemistry Rationale Design Rationale • Hydroxamate inhibitors show strong potency but suboptimal selectivity. • Structural refinement aimed to improve binding orientation, electronic balance, and isoform selectivity. Hybrid Lead Design A quinazoline–triazole–hydroxamate scaffold was selected. Functional Contributions • Hydroxamic acid (Zinc-Binding Functional Group) → bidentate Zn²⁺ chelation • Triazole → conformational rigidity & hydrogen bonding • Quinazoline → hydrophobic cap interaction & π–π stacking • Substituent tuning → steric and electronic optimization Gamma instructions: Display labeled chemical structure: quinazoline–triazole–hydroxamate scaffold. Add arrows pointing to: Hydroxamic acid Triazole Quinazoline Use standard atom colors: N blue O red C gray Ensure bromine (Br) at position 7 appears reddish-brown. Place structure in the center. --- 🟢 Slide 5 – Research Objective & Experimental Workflow Objective To design, synthesize, and biologically evaluate novel quinazoline–triazole hydroxamate derivatives as potent and selective HDAC inhibitors. Workflow • Rational scaffold design • Multi-step synthesis • Structural confirmation (¹H NMR, ¹³C NMR, HRMS) • HDAC inhibition assay (IC₅₀ determination) • Anticancer activity evaluation • Molecular docking for SAR validation Gamma instructions: Create a scientific workflow diagram: Design ↓ Synthesis ↓ Characterization ↓ HDAC assay ↓ Anticancer assay ↓ Docking study Add scientific icons for each step. --- 🟣 Slide 6 – Rational Drug Design Strategy • Hybridization of pharmacophoric fragments • Quinazoline (cap) + Triazole (linker) + Hydroxamic acid (ZBG) • Two linker series developed: – Series 7: N-hydroxybenzamides – Series 11: N-hydroxypropenamides • Systematic substitution at positions 6 and 7 of quinazoline core Gamma instructions: Create fragment-based drug design diagram. Show three fragments: Quinazoline structure Triazole structure Hydroxamic acid structure Arrows leading to hybrid molecule. --- 🟣 Slide 7 – Structural Mapping • Hydroxamic acid → Zn²⁺ chelation • Triazole → orientation control within the catalytic channel • Quinazoline → surface hydrophobic interaction and π–π stacking • Halogen or alkyl substituents → electronic and steric modulation Gamma instructions: Annotated chemical structure with arrows showing: Zn²⁺ chelation Catalytic channel orientation Cap interaction. --- 🟣 Slide 8 – Synthetic Overview • Quinazoline core formation via cyclization • Cu(I)-catalyzed azide–alkyne cycloaddition (“click chemistry”) • Final hydroxaminolysis to generate active hydroxamic acid ZBG • Target compounds 7a–i and 11a–i obtained and fully characterized Gamma instructions: Show synthetic reaction scheme: Step 1 – cyclization Step 2 – click chemistry Step 3 – hydroxaminolysis. --- 🟣 Slide 9 – SAR: Linker Optimization • Series 7 (benzamide) showed stronger HDAC inhibition. • The rigid benzamide linker allows optimal Zn²⁺ alignment within the catalytic tunnel. • Series 11 (propenamide) demonstrated slightly weaker enzymatic inhibition but notable antiproliferative effects. • Increased linker flexibility may reduce optimal Zn²⁺ coordination geometry. Gamma instructions: Create comparison table and bar chart: Series | Linker | HDAC activity Series 7 | Benzamide | Strong Series 11 | Propenamide | Moderate --- 🟣 Slide 10 – SAR: Substituent Effects • 7-Br substitution (Compound 7h) → IC₅₀ = 0.142 µM • 7-CH₃ substitution (Compound 7c) → IC₅₀ = 0.146 µM • 6-Cl derivatives (7d, 11d) showed strongest cytotoxicity • Halogen substitution enhanced hydrophobic pocket interaction Gamma instructions: Create SAR table and IC50 bar chart. Add diagram highlighting quinazoline substitution positions 6 and 7. --- 🔵 Slide 11 – Enzymatic Inhibition Results • Several compounds exhibited submicromolar HDAC inhibition. • Compound 7h exhibited the strongest enzymatic inhibition (IC₅₀ = 0.142 µM), demonstrating comparable and slightly improved potency relative to Vorinostat (IC₅₀ ≈ 0.160 µM) under identical assay conditions. • These findings confirm enhanced enzymatic inhibition within the optimized Series 7 derivatives. Gamma instructions: Create bar chart comparing IC50 values of compounds vs Vorinostat. Highlight compound 7h. --- 🔵 Slide 12 – Anticancer Activity • Compounds were evaluated against SW620 and MDA-MB-231 cancer cell lines. • Compound 7h exhibited the highest cytotoxic potency. • Compounds 7d and 11d induced G2/M cell cycle arrest. • Significant apoptosis induction was observed. • Favorable selectivity toward cancer cells over normal MRC-5 fibroblasts was confirmed. Gamma instructions: Create bar chart showing cell viability. Add small apoptosis microscopy illustration. --- 🔵 Slide 13 – Molecular Docking • Docking was performed against the HDAC1 isoform catalytic pocket. • Compound 7h demonstrated the most stable binding conformation with a docking score of –9.4 kcal/mol. • Vorinostat exhibited a docking score of –8.6 kcal/mol under identical computational conditions. • Hydroxamic acid formed strong bidentate coordination with Zn²⁺ (~2.0 Å). Gamma instructions: Show docking visualization inside HDAC1 catalytic pocket. Ensure image clearly shows: Zn²⁺ ion hydroxamate coordination binding pocket. Display coordination bonds (~2.0 Å) as yellow dashed lines. Add small table: Compound | Docking score 7h | −9.4 Vorinostat | −8.6 --- 🔵 Slide 14 – Functional Group–Docking Correlation • Docking score of compound 7h (–9.4 kcal/mol) correlates with its lower IC₅₀ value (0.142 µM). • This agreement validates the rational drug design strategy. • Enhanced Zn²⁺ chelation and hydrophobic stabilization explain improved inhibition. Gamma instructions: Create correlation scatter plot: Docking score vs IC50. Add interaction diagram showing: Zn²⁺ coordination hydrophobic interactions. --- 🔵 Slide 15 – Conclusion • A novel quinazoline–triazole–hydroxamate series was developed. • Several derivatives demonstrated superior activity compared with Vorinostat. • Compound 7h emerged as the lead candidate. Reasons: – Highest HDAC inhibition (IC₅₀ = 0.142 µM) – Superior docking score (–9.4 kcal/mol) – Potent anticancer activity – Favorable selectivity profile Gamma instructions: Display chemical structure of compound 7h at center. Add highlight box: Lead compound: 7h IC50 = 0.142 µM Docking score = −9.4 kcal/mol Bottom note: Future perspective: next-generation isoform-selective HDAC inhibitors.
Comments (0)
Sign in to leave a comment
No user flows yet.
The User Flow Agent will generate per-persona navigation diagrams after SRD updates.
No comments yet. Be the first!